Retinotopy and the Visual Cortical Hierarchy: How the Brain Maps What You See
In 1995, Martin Sereno and colleagues used fMRI to precisely map — for the first time in living humans — the borders of five distinct visual areas in the occipital cortex. This article explains what retinotopy is, how the hierarchy of visual areas from V1 through MT organizes visual processing, why the fovea commands disproportionate cortical space, and how the two-stream model (ventral 'what' and dorsal 'where/how') has evolved from a clean bifurcation into something considerably messier and more interesting.

The human visual system does not look like a single camera. It looks like a series of maps — stacked, interconnected, and each a little stranger than the last. To understand how the FFA recognizes faces or the PPA reads a room, you first have to understand the territory those regions sit in: a hierarchy of retinotopic cortical areas that begins in the occipital lobe and fans out across half the brain. That hierarchy is the subject of this article.
What retinotopy means, and why it matters
"Retinotopic" is one of those words that sounds more technical than it is. It simply means that the spatial layout of the retina is preserved, at least approximately, in the cortex. Neighboring points on the retina send signals to neighboring neurons in visual cortex. The result is a map — not a photograph, but a genuine topographic map of visual space spread across the cortical surface.
This property was established for primary visual cortex (V1) through decades of anatomy and lesion work in animals. What wasn't known until 1995 was how far that map-based organization extends in the human brain — and how many separate maps there are.
The landmark study: Sereno et al. (1995)
In 1995, Martin Sereno, Anders Dale, and colleagues published a paper in Science titled "Borders of Multiple Visual Areas in Humans Revealed by Functional Magnetic Resonance Imaging." 1 It has since been cited more than 3,200 times — a number that reflects how foundational the finding turned out to be.
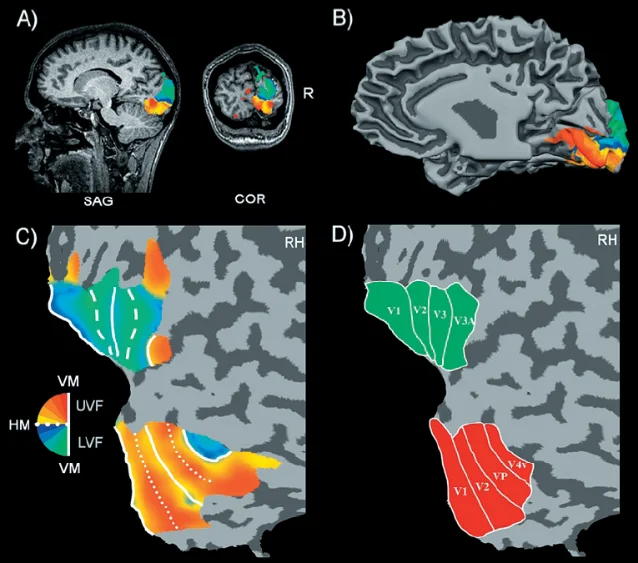
The experimental approach was elegant. Participants viewed either a rotating wedge stimulus (which swept through polar angles in the visual field) or an expanding/contracting ring stimulus (which mapped eccentricity — how far from fixation a point falls). By correlating the phase of the fMRI BOLD signal with the angular position or eccentricity of the stimulus, the researchers could read off, at each point on the cortex, what part of the visual field that patch of neurons responded to.
The result: at least eight distinct visual field maps in the human occipital cortex, with clear borders between them. V1, V2, VP, V3, and V4 were precisely delineated — non-invasively, in living humans — for the first time.
Why does a map boundary matter? Because adjacent visual areas represent visual space in a mirror-flip relationship. The upper edge of V1 responds to the lower visual field; cross into V2, and lower-field responses appear at the top. This alternating mirror pattern creates the boundaries that let researchers carve one visual area from the next. Without retinotopic mapping, visual area delineation in humans had to rely on cytoarchitectural staining (expensive, post-mortem) or on loose inferences from lesion patterns. Sereno et al. made it possible to ask, in every living participant, "exactly where does V1 end and V2 begin?"
The hierarchy: from V1 to the high-level areas
Visual cortex is not a flat collection of equal regions. It is hierarchically organized, and that hierarchy has real functional consequences.
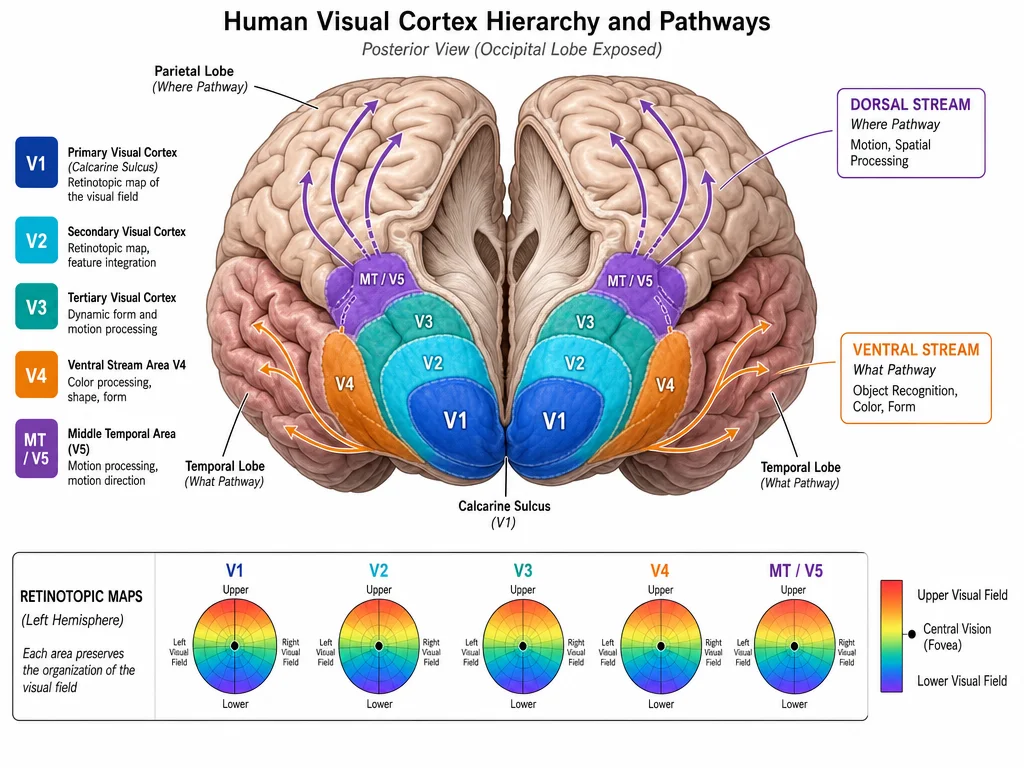
V1 — primary visual cortex sits at the base of the hierarchy in the calcarine sulcus, the main fold running through the occipital pole. Each hemisphere's V1 contains a complete map of the contralateral visual field. V1 neurons respond to simple features: edges at specific orientations, particular spatial frequencies, and specific colors. Receptive fields here are small — each neuron "sees" only a tiny patch of the visual world. Critically, the fovea (the central 2–5° of the visual field where acuity is highest) occupies a disproportionately large fraction of V1 — a phenomenon called cortical magnification. The foveal representation alone accounts for roughly half of V1's surface area, even though the fovea covers less than 0.01% of the total visual field. 3
V2 receives direct input from V1 and wraps around it in a horseshoe pattern, split into dorsal and ventral halves. V2 neurons respond to somewhat more complex properties than V1 — illusory contours, binocular disparity cues, and figure-ground segmentation all begin to emerge here. 4
V3 and VP (ventral posterior) occupy the next strip of cortex anterior to V2. V3 neurons are tuned to orientation and spatial frequency, similar to V1 and V2, but receptive fields are somewhat larger and less well understood than their neighbors. There is genuine scientific debate about the boundaries of "V3" — some researchers argue the region anterior to V2 contains two or three functionally distinct subdivisions, not one, and the exact functional organization of V3 compared to V1 and V2 remains less settled. 4
V4 and hV4 contribute strongly to color perception. V4 neurons are broadly tuned to wavelength and, in the human brain, the hV4 region on the ventral surface sits at a critical node for conscious color experience. Damage to this region produces achromatopsia — the permanent loss of color perception, leaving the world looking like a black-and-white photograph. 4
MT (V5) — the middle temporal area is specialized for motion. MT neurons respond vigorously to moving stimuli and are critical for perceiving the direction and speed of motion. MT is unusual in receiving direct input from V1, bypassing the V2/V3 relay, suggesting that speed matters more than completeness when processing motion signals. 4
As you move up the hierarchy from V1 toward high-level areas, three trends run in parallel: receptive fields get larger (neurons respond to bigger patches of the visual scene); stimulus preferences get more complex (from edges to shapes to objects to faces and scenes); and the topographic map becomes less precise. By the time you reach the FFA or PPA, discussed in the previous articles in this series, retinotopic organization is essentially gone — those areas respond to categories of visual input, not to locations in the visual field.
Two streams diverging from V1
In 1982, Leslie Ungerleider and Mortimer Mishkin published a landmark anatomical and behavioral study in macaques demonstrating that visual information leaving V1 splits into two functionally distinct pathways. 5 The ventral stream runs from V1 → V2 → V4 → inferior temporal cortex; the dorsal stream runs from V1 → V2 → MT → posterior parietal cortex. Ungerleider and Mishkin originally characterized these as the "what" pathway (object identity, ventral) and the "where" pathway (spatial location, dorsal). Selective lesions to each pathway produced selective deficits: temporal lesions impaired object discrimination; parietal lesions impaired spatial tasks.
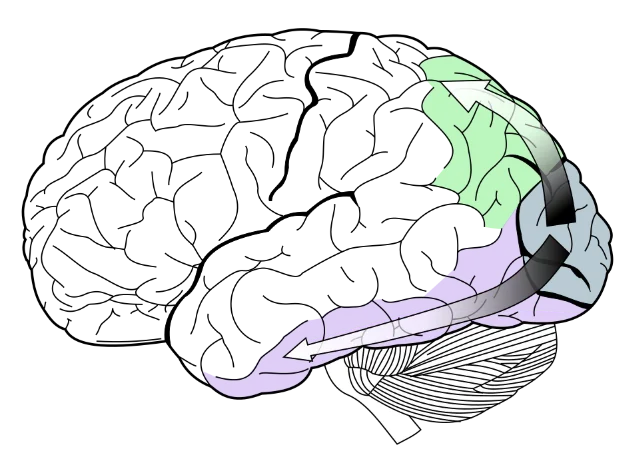
The two-stream model has since been updated considerably. Goodale and Milner (1992) proposed a more precise revision: rather than "what vs. where," the split is better described as "vision for perception vs. vision for action." The ventral stream builds conscious, stable representations of objects — what something is, and what it looks like. The dorsal stream guides real-time motor actions — how to reach for it, grasp it, or navigate around it. Supporting evidence came from the patient D.F., who lost ventral stream function but retained dorsal stream function after a carbon monoxide accident: she could not consciously perceive the orientation of a slot, yet could correctly orient her hand to post a card through it. 6
More recent work by Baker, Kravitz, and colleagues (2024) has pushed further still, arguing that neither "two parallel hierarchies" nor "two independent streams" captures the actual anatomy. The pathways are better described as recurrent heterarchies — networks full of skip connections, reciprocal projections, and extensive cross-talk between what was originally described as two separate channels. V1, for example, projects not only to V2 but directly to V3, V4, MT, and V6. MT sits at a crossroads, receiving dorsal-stream connections yet projecting into ventral-stream regions of the superior temporal sulcus. The initial model was a productive simplification; the real anatomy is messier, and more interesting. 6
The cortical magnification factor: why you can't see the corners
One of the most counterintuitive properties of V1 is the mismatch between the visual field and its cortical representation. The fovea — the central few degrees of vision — gets vastly more cortical real estate than the periphery. The cortical magnification factor (CMF) describes this ratio: roughly how many millimeters of cortex correspond to one degree of visual angle at a given eccentricity. Near the fovea, the CMF can be 6–8 mm per degree; at 10° eccentricity, it drops to under 1 mm per degree. The ratio between central and peripheral representation has been estimated at more than 40:1. 3
This is why you cannot read text in your peripheral vision, why a face recognized in central vision becomes a blur when it drifts to 15° eccentricity, and why the FFA and PPA — which receive much of their input from the ventral stream — are so much better at processing foveal information than peripheral. The CMF is not a quirk of wiring; it is a core architectural decision that shapes everything downstream.
Open debates
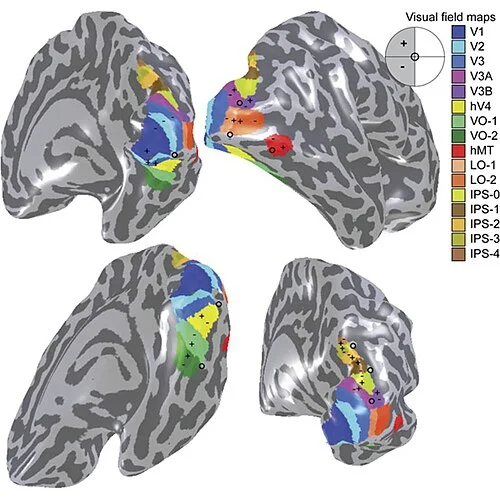
How many visual areas are there? The number keeps growing. Sereno et al. (1995) delineated five areas; a comprehensive 2012 atlas by Wang and colleagues identified more than 25 retinotopic maps in the human visual system. 7 The precise functional roles of many of these areas — particularly the ventral-occipital (VO) cluster, the lateral-occipital (LO) areas, and the IPS regions — remain under active investigation.
Is V3 a single area? Researchers have debated for decades whether "V3" is anatomically and functionally coherent, or whether it represents two distinct subdivisions (dorsal V3 and ventral V3/VP) with different connections and different response properties. The disagreement is not resolved.
How do feedback connections change early visual responses? The classical feed-forward model — signals flow from V1 → V2 → V3 → V4 → IT — is now known to be an oversimplification. V1 neurons receive massive feedback from higher areas and respond differently to the same stimulus depending on context, attention, and even what you expect to see next. The functional significance of this feedback remains a major area of research.
Why it matters
Retinotopy is not just an anatomical curiosity. It is the coordinate system within which all subsequent visual computation happens. The FFA's face selectivity and the PPA's scene selectivity — both discussed in earlier articles in this series — are only interpretable once you understand that these regions sit outside the retinotopic hierarchy, at a point where spatial maps have dissolved and category-level representation has taken over. The question of why the visual hierarchy ends its map-based organization at some point, and transitions to object-category representation, is one of the deepest open questions in cognitive neuroscience.
Understanding retinotopy also underlies modern visual prosthetics research. If you know the precise map, you can in principle stimulate V1 at specific locations to create phosphenes (flashes of light) at predictable positions in the visual field. Several groups are pursuing cortical visual prosthetics based on exactly this logic — Sereno's 1995 map is, in a sense, the wiring diagram they are working from.
Landmark paper: Sereno, M.I., Dale, A.M., Reppas, J.B., Kwong, K.K., Belliveau, J.W., Brady, T.J., Rosen, B.R., & Tootell, R.B.H. (1995). Borders of multiple visual areas in humans revealed by functional magnetic resonance imaging. Science, 268(5212), 889–893. 1
Course connection: MIT 9.13 The Human Brain (Prof. Nancy Kanwisher) — Lecture 3 covers the visual system and topographic organization. The full course is freely available at MIT OpenCourseWare.
References
- 1Sereno et al. 1995, Science
- 2BrainVoyager Retinotopic Mapping Guide
- 3UCSF Horton Lab: Organization of Primary Visual Cortex
- 4Visual cortex — Wikipedia
- 5Ungerleider & Mishkin 1982, reprinted via CNS.NYU.EDU
- 6Baker & Kravitz 2024, JOCN — Insights from the Evolving Model of Two Cortical Visual Pathways
- 7Retinotopic Organization of Human Ventral Visual Cortex — Arcaro et al. 2009, J Neuroscience
Add more perspectives or context around this Post.